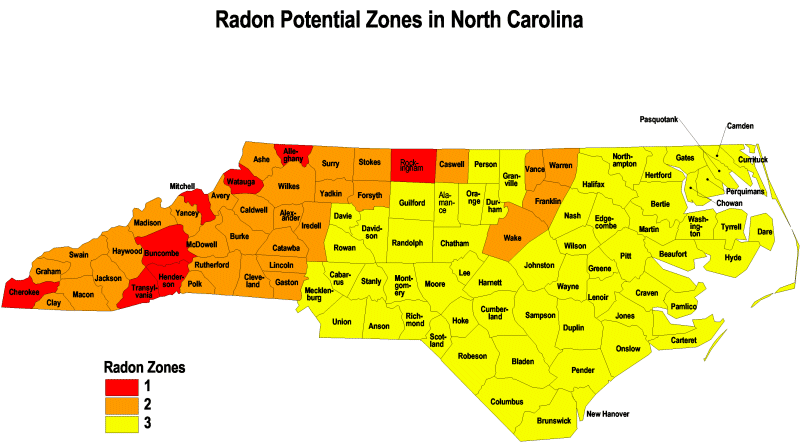
This map was created from the EPA's map of Radon Zones. It depicts the potential for radon in indoor air in a given area. The EPA calls this the "predicted indoor radon screening potential". Zone One areas have an average predicted indoor radon screening potential greater than 4 pCi/l. Zone Two areas are predicted to have an average indoor radon screening potential between 2 pCi/l and 4 pCi/l. Zone Three areas are predicted to have an average indoor radon screening potential less than 2 pCi/l. These predicted radon levels are based on physical characteristics like geology and soil types. It should be used as an aid for predicting the radon potential for a given area. Homes with elevated levels of radon have been found in all three zones. All homes should be tested for radon, regardless of zone designation. Contact the Division of Radiation Protection's Nuclear Facilities and Environmental Radiation Surveillance Section for further information.